DeTTECT
DeTTECT
About
DeTTECT excels at mapping known capabilities to defender visibility, and the likelihood -or opportunity- they would have to observe particular TTPs or the coverage they might have over a specific attacker group. DeTTECT is a tool is mostly aimed at blue team defenders to aid them in identifying where they should have visibility into attacks and where they may have gaps. As such, it can be a great complement to analysis activities to aid in likelihood and risk calculations.
The tool has both a command line and a web-based interface, however, these serve different purposes. The web GUI provides an easy way to add data and information about an environment into the local "database", while the CLI allows for and enables the data analysis and MITRE ATT&CK framework templates for analysis.
Overview
The article, DeTT&CT: Mapping your Blue Team to MITRE ATT&CK™, is a great overview of the DeTT&CT tool from back when it was first released.
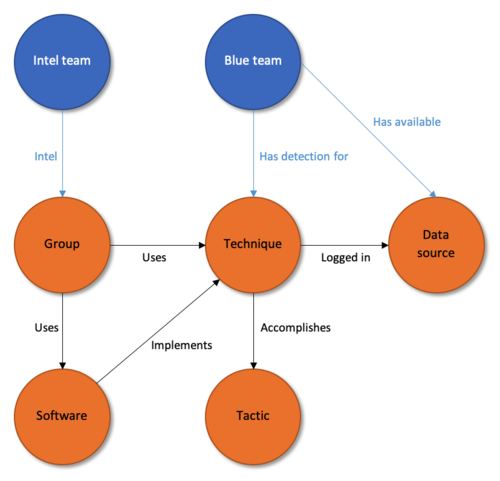
DeTT&CT enables the blue team to connect the dots by mapping mapping visibility and TTP defenses against the MITRE framework.
Getting Started
Getting started page on the DeTTECT wiki.
Running DeTTECT
As with all things, it's recommended to review the Dockerfile and build the image yourself. For a quick start, you can pull their official image from Docker Hub docker pull rabobankcdc/dettect:latest
Pre-requisites:
- Docker must be installed
- create a directory where you will store any saved DeTTECT data
cdto this directory before running thedocker runcommand
- Build the #docker image. I prefer to tag it with the current release version as on the releases page:
docker build -t dettect:latest -t dettect:1.8.0 .or pull the official one from Docker Hub withdocker pull rabobankcdc/dettect:latest - Run the container
docker run --rm -it --name dettect -p 127.0.0.1:8080:8080/tcp -v $(pwd)/output:/opt/DeTTECT/output -v $(pwd)/input:/opt/DeTTECT/input dettect:latest /bin/bash - Launch the editor
python dettect.py editor & - Navigate to http://localhost:8080/ to use the editor
- End the container
docker rm dettect
Using sample data
Christopher Peacock has created a nice sample file with many pre-populated elements so it's easy to take a look around and see what DeTTECT can do.
Data Quality
A set of scoring tables describes the level or quality of the item being measured.
Advanced Usage
Once you've tested the waters with the tool, you'll want to make sure you're setup in such a way as to not lose work and be able to retain data over time. The command to launch the container included output and input directories, so it needs to be launched
Redirect the working directories to save data
Use of the -v option in docker allows one to specify volume or directory redirection into the container. This example builds upon the getting started example and redirects the input and ouput (load and save) directories, so saves will remain on the host system.
docker run --rm -it --name dettect -p 127.0.0.1:8080:8080/tcp -v $(pwd)/output:/opt/DeTTECT/output -v $(pwd)/input:/opt/DeTTECT/input dettect:latest /bin/bash
Example Analysis workflow using DeTTECT
High level overview
graph LR

   Step1(Build framework) --> Step2a(Identify coverage) & Step2b(Identify visibility)
   Step2b --> Step3(map detections)
   Step2a & Step3 --> Step4(Analyze Data) --> Step5(Determine gaps & priorities)
Workflow
- Define our applicability categories for the
applicable_tofield:- Broad categories
- Enterprise
- Products we Run
- Products we Ship
- System level
- IaaS providers: AWS, Azure, GCP, etc.
- SaaS
- On-prem and data center
- User endpoints / devices w/ mobility (distinction btwn laptops and phone/tablet?
laptopandmobilecould be the right distinctions there.)
- Broad categories
- Create the data Sources File
- One file per broad category above
- The "system level" can be mapped in the Systems field, and the relevant platforms are documented under that
- input data / map out the data sources provided by deployed tools to define the realm of the possible
- date registered is when we acknowledge this as a part of the program (i.e. when we became aware of the need for this data)
- date connected is when the data is available for use (i.e. in the SIEM)
- enter the product(s) the company has in place (or should have) that can provide the necessary visibility
- enabled is whether this source is in a state where events are being generatred
- If this remains unchecked, it means the capability is not there or the data collection has not been turned on
- this may be resident within its own tool or platform, but not going to the SIEM
- Use the scoring chart for describing level of visibility.
- available for analytics means the data is flowing into the SIEM and usable by SecOps for analysis and use-case development
- Create the Techniques file(s)
- Could be tracked as one massive file or multiple; a single, holistic data file seems more manageable
- Input data / map out the techniques data to define our visibility and detections
- Entered by MITRE technique
- Approach: Should we front-load all with 0 capability and fill from there or start blank and add what we know?
- (task: is there a pre-built data set with the techniques but all zeroed out?)
- Approach: Should we front-load all with 0 capability and fill from there or start blank and add what we know?
- visbility vs. detection
- Enter the assumed/known visibility for the technique
- Enter the ability to detect the techniques based upon published use cases
- question: does "detection" == "alert"? or do we need to make a distinction here?
- enter score(s) and date(s) for when that capability went live
- Apply the
applicable_todesignation to each of the above- These need to map exactly to the applicability categories from the data sources file
- Entered by MITRE technique
- Create a Group file
- Name the file for the group(s) to be analyzed, Pure quarterly report, whatever
- transcribe data from CTI into the file
- Data analysis
- use the date field to show where we currently are and the gaps to be addressed
- convert data from the YAML file(s) for use with the ATT&CK Navigator
- create a heat map of the visibility
- on a new tab, create a heat map of the detections
- on a new tab(s), create a heat map of attacker profile(s)
- use "tab math" in the Navigator to:
- demonstrate opportunities for improvement
- identify gaps in coverage vs. likely attacks
- identify under-utilised tools
- make pretty pictures
- use the graph function (
-g) to demonstrate progress over time. - for the above, filter on the
applicable_tofield in order to generate data for specific areas of interest
Converting DeTTECT data for use with the ATT&CK Navigator
The real power from DeTTECT comes with marrying its data with other data regarding TTPs within the ATT&CK Navigator - note that this URL removes the yellow underline as recommended in the wiki docs.
Viewing Detections on the Navigator
To visualize the recorded detection capabilities in the ATT&CK Navigator, use dettect.py to convert the YAML to a JSON-formatted layer usable by the online tool.
Example:
python dettect.py d -ft input/detections.yaml -of detection-layer -l
The -l tells the script to create a Navigator layer. If configured as laid out above, this will create a file named detection-layer.json in the output/ directory.
Tracking Groups
The "groups" section allows for tracking threat actors or other types when you want to track collections of TTPs.
Visualizing Group data in Navigator
The recorded group data can be visualized in Navigator by converting the YAML to JSON.
python dettect.py g -g <yaml file>
Analyzing the Data with EQL
By giving the data context with information such as data_quality scores, the date_connected, or applicable_to , we can use these fields to filter the data and generate ATT&CK navigator layers with a specific focus.
We can use the Event Query Language "EQL" by Endgame to query specific aspects of the data. As a reference, the below output is the default schema for the data sources YAML files and EQL may be used to ask questions of the data.
{'data_sources': {'applicable_to': 'string',
                  'available_for_data_analytics': 'boolean',
                  'comment': 'string',
                  'data_quality': {'consistency': 'number',
                                   'data_field_completeness': 'number',
                                   'device_completeness': 'number',
                                   'retention': 'number',
                                   'timeliness': 'number'},
                  'data_source_name': 'string',
                  'date_connected': 'null',
                  'products': ['string']}}
For example, when cataloging the data sources, one of the identified systems may be called "Recon" with the associated PRE techniques from the framework. Then, the analyst would map the visibility of certain techniques to the identified systems, as well as the product(s) providing that visibility.
!Pasted image 20230811111429.png
In the editor screenshot above, we can see:
- The identified system called "Recon" (it should be noted that this doesn't make sense as a system and is done as example only)
- The Platforms applicable to the "Recon" system. In this case "PRE"
- The name of the technique to which we're going to map data sources
- The designation that Cloud Service Enumeration is applicable_to the "Recon" system
If we generate a layer from the data sources file being edited in the image above, we'll get all the systems, but if we want to look at just the information applicable_to "Recon", we can generate the layer like so:
python dettect.py ds -fd input/DataSources.yaml --layer --search "data_sources where applicable_to = 'Recon'"
Let's go through that
python dettect.pyinvokes the scriptdsinforms the system that we're working with data source data-fddesignates the path and file containing the data source data- target file is
DataSources.yamlin theinputdirectory
- target file is
--layertells dettect that we want to create a Navigator layer from the data--searchthen specifies our EQL query- the search is looking in
data_sourcesand will only match data where theapplicable_tohasRecon
- the search is looking in
Filtering Examples
Filtering on applicable_to
The applicable_to field defines what a given visibility or detection is relevant within the analysed environment. This field can be filtered when you want to focus on just a specific environment to understand the coverage or attack surface, example from the wiki docs:
Filter on the key-value pair
applicable_towithin the techniques administration YAML file. For example, to only include 'Windows workstations':
python dettect.py d -ft sample-data/techniques-administration-endpoints.yaml --layer --search-detection "techniques where arrayContains(detection.applicable_to, 'Windows workstations')"
Multiple applicable_to values can be provided by adding a comma after 'Windows workstations' and a new value.
Filtering on date
As the data is added over time, the dates of data entries can be used to show a point-in-time situation or for trending purposes.
Example:
python dettect.py d -ft sample-data/techniques-administration-endpoints.yaml -l --search-detection "techniques where detection.score_logbook.date < '2022-10-31'" --all-scores
Would show everything before Halloween '22.
Complementary Tools and Tips
YAML file maintenance
Upgrading versions
From time-to-time, the YAML schema will be updated, making previous work incompatible with newer versions of the tool. In order to upgrade these, use the following command
python ./dettect.py ds -fd /opt/DeTTECT/input/<filename>
DeTTECTinator: auto-YAML generation
Automate the generation and modification of these YAML files? That's were Dettectinator comes in!